yEd Diagram Plugin
N2G yEd Module supports producing graphml XML structured text files that can be opened by yWorsk yEd Graph Editor or yEd web application.
Quick start
Nodes and links can be added one by one using add_node and add_link methods
from N2G import yed_diagram
diagram = yed_diagram()
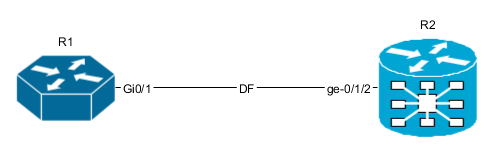
diagram.add_node('R1', top_label='Core', bottom_label='ASR1004')
diagram.add_node('R2', top_label='Edge', bottom_label='MX240')
diagram.add_link('R1', 'R2', label='DF', src_label='Gi0/1', trgt_label='ge-0/1/2')
diagram.layout(algo="kk")
diagram.dump_file(filename="Sample_graph.graphml", folder="./Output/")
After opening and editing diagram, it might look like this:
Adding SVG nodes
By default N2G uses shape nodes, but svg image can be sourced from directory on your system and used as node image instead. However, svg images as nodes can support only one label attribute, that label will be displayed above svg picture.
from N2G import yed_diagram

diagram = yed_diagram()
diagram.add_node('R1', pic="router.svg", pic_path="./Pics/")
diagram.add_node('R2', pic="router_edge.svg", pic_path="./Pics/")
diagram.add_link('R1', 'R2', label='DF', src_label='Gi0/1', trgt_label='ge-0/1/2')
diagram.layout(algo="kk")
diagram.dump_file(filename="Sample_graph.graphml", folder="./Output/")
After opening and editing diagram, it might look like this:
Nodes and links data attributes
Description and URL attributes can be added to node and link. Description attribute can be used by yEd to search for elements as well as diagrams exported in svg format can display data attributes as a tooltips.
from N2G import yed_diagram

diagram = yed_diagram()
diagram.add_node('R1', top_label='Core', bottom_label='ASR1004', description="loopback0: 192.168.1.1", url="google.com")
diagram.add_node('R2', top_label='Edge', bottom_label='MX240', description="loopback0: 192.168.1.2")
diagram.add_link('R1', 'R2', label='DF', src_label='Gi0/1', trgt_label='ge-0/1/2', description="link media-type: 10G-LR", url="github.com")
diagram.layout(algo="kk")
diagram.dump_file(filename="Sample_graph.graphml", folder="./Output/")
After opening and editing diagram, it might look like this:
Node R1 and link should be clickable on above image as they contain URL information, tooltip should be displayed if svg will be open on its own.
Loading graph from dictionary
Diagram elements can be loaded from dictionary structure. That dictionary may contain nodes, links and edges keys, these keys should contain list of dictionaries where each dictionary item will contain elements attributes such as id, labels, description etc.
from N2G import yed_diagram

diagram = yed_diagram()
sample_graph={
'nodes': [
    {'id': 'a', 'pic': 'router.svg', 'label': 'R1' },
    {'id': 'R2', 'bottom_label':'CE12800', 'top_label':'1.1.1.1'},
    {'id': 'c', 'label': 'R3', 'bottom_label':'FI', 'top_label':'fns751', 'description': 'role: access'},
    {'id': 'd', 'pic':'firewall.svg', 'label': 'FW1', 'description': 'location: US'},
    {'id': 'R4', 'pic': 'router'}
],
'links': [
    {'source': 'a', 'src_label': 'Gig0/0\nUP', 'label': 'DF', 'target': 'R2', 'trgt_label': 'Gig0/1', 'description': 'role: uplink'},
    {'source': 'R2', 'src_label': 'Gig0/0', 'label': 'Copper', 'target': 'c', 'trgt_label': 'Gig0/2'},
    {'source': 'c', 'src_label': 'Gig0/0', 'label': 'ZR', 'target': 'a', 'trgt_label': 'Gig0/3'},
    {'source': 'd', 'src_label': 'Gig0/10', 'label': 'LR', 'target': 'c', 'trgt_label': 'Gig0/8'},
    {'source': 'd', 'src_label': 'Gig0/11', 'target': 'R4', 'trgt_label': 'Gig0/18'}
]}
diagram.from_dict(sample_graph)
diagram.layout(algo="kk")
diagram.dump_file(filename="Sample_graph.graphml", folder="./Output/")
After opening and editing diagram, it might look like this:
Loading graph from list
From list method allows to load graph from list of dictionaries, generally containing link details like source, target, labels. Additionally source and target can be defined using dictionaries as well, containing nodes details.
Note
Non-existing node will be automatically added on first encounter, by default later occurrences of same node will not lead to node attributes change, that behavior can be changed setting node_duplicates yed_diagram attribute equal to update value.
from N2G import yed_diagram
diagram = yed_diagram()
sample_list_graph = [
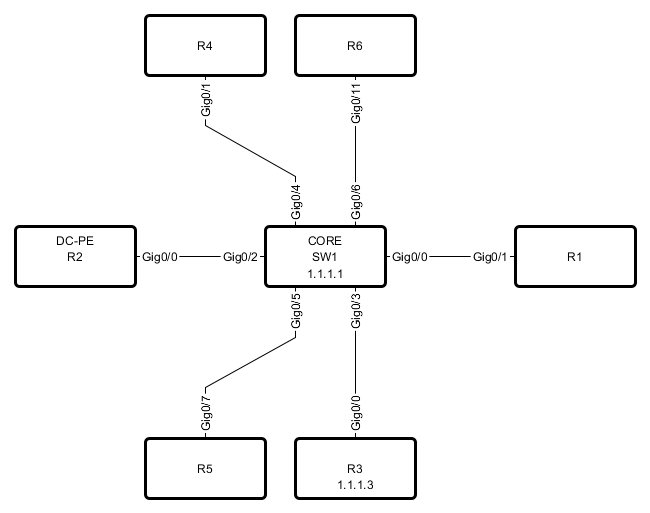
{'source': {'id': 'SW1', 'top_label': 'CORE', 'bottom_label': '1,1,1,1'}, 'src_label': 'Gig0/0', 'target': 'R1', 'trgt_label': 'Gig0/1'},
{'source': {'id': 'R2', 'top_label': 'DC-PE'}, 'src_label': 'Gig0/0', 'target': 'SW1', 'trgt_label': 'Gig0/2'},
{'source': {'id':'R3', 'bottom_label': '1.1.1.3'}, 'src_label': 'Gig0/0', 'target': 'SW1', 'trgt_label': 'Gig0/3'},
{'source': 'SW1', 'src_label': 'Gig0/4', 'target': 'R4', 'trgt_label': 'Gig0/1'},
{'source': 'SW1', 'src_label': 'Gig0/5', 'target': 'R5', 'trgt_label': 'Gig0/7'},
{'source': 'SW1', 'src_label': 'Gig0/6', 'target': 'R6', 'trgt_label': 'Gig0/11'}
]
diagram.from_list(sample_list_graph)
diagram.dump_file(filename="Sample_graph.graphml", folder="./Output/")
After opening and editing diagram, it might look like this:
Loading graph from csv
Similar to from_dict or from_list methods, from_csv method can take csv data with elements details and add them to diagram. Two types of csv table should be provided - one for nodes, another for links.
from N2G import yed_diagram

diagram = yed_diagram()
csv_links_data = """"source","src_label","label","target","trgt_label","description"
"a","Gig0/0\nUP","DF","R1","Gig0/1","vlans_trunked: 1,2,3\nstate: up"
"R1","Gig0/0","Copper","c","Gig0/2",
"R1","Gig0/0","Copper","e","Gig0/2",
d,Gig0/21,FW,e,Gig0/23,
"""
csv_nodes_data=""""id","pic","label","bottom_label","top_label","description"
a,router,"R12",,,
"R1",,,"SGD1378","servers",
"c",,"R3","SGE3412","servers","1.1.1.1"
"d","firewall.svg","FW1",,,"2.2.2.2"
"e","router","R11",,,
"""
diagram.from_csv(csv_nodes_data)
diagram.from_csv(csv_links_data)
diagram.dump_file(filename="Sample_graph.graphml", folder="./Output/")
After opening and editing diagram, it might look like this:
Loading existing diagrams
N2G yEd module uses custom nmetadata and emetadata attributes to store original node and link id. For nodes, nmetadata contains node id in a format {'id': 'node_id_value'}, for links emetadata contains source and target node ids as well as link id, e.g. {"sid": "SW1", "tid": "R6", "id": "8e96ade0d90d33c3308721dc2a53b391"}, where link id calculated using rules described in API reference section.
nmetadata and emetadata custom attributes used to properly load previously produced diagrams for modification, as a result:
Warning
currently, N2G yEd module can properly load only diagrams that were created by this module in the first place or diagrams that had manually added nmetadata and emetadata attributes.
N2G yEd module provides from_file and from_text methods to load existing diagram content, to load diagram from file one can use this as example:
from N2G import yed_diagram

diagram = yed_diagram()
diagram.from_file("./source/diagram_old.graphml")
After diagram loaded it can be modified or updated using add_x, from_x, delete_x or compare methods.
Diagram layout
To arrange diagram nodes in certain way one can use layout method that relies on igraph library to calculate node coordinates in accordance with certain algorithm. List of supported layout algorithms and their details can be found here together with brief description in API Reference section.
Sample code to layout diagram:
from N2G import yed_diagram

diagram = yed_diagram()
diagram.from_file("./source/diagram_old.graphml")
diagram.layout(algo="drl", width=500, height=500)
diagram.dump_file(filename="Sample_graph.graphml", folder="./Output/")
Comparing diagrams
Comparing diagrams can be useful to spot changes in your system. N2G compare method allow to calculate differences between old and new graphs and produce resulting diagram highlighting changes.
from N2G import yed_diagram

diagram = yed_diagram()
old_graph = {
'nodes': [
    {'id': 'R1'}, {'id': 'R2'}, {'id': 'R3'},
    ],
'edges': [
    {'source': 'R1', 'target': 'R2'},
    {'source': 'R2', 'target': 'R3'},
    {'source': 'R3', 'target': 'R1'}
]}
new_graph = {
'nodes': [
    {'id': 'R1'}, {'id': 'R2'}, {'id': 'R4'},
    ],
'edges': [
    {'source': 'R1', 'target': 'R2'},
    {'source': 'R2', 'target': 'R4'}
]}
diagram.from_dict(old_graph)
diagram.compare(new_graph)
diagram.layout(algo="kk", width=500, height=500)
diagram.dump_file(filename="Sample_graph.graphml", folder="./Output/")
Original and after diagrams:
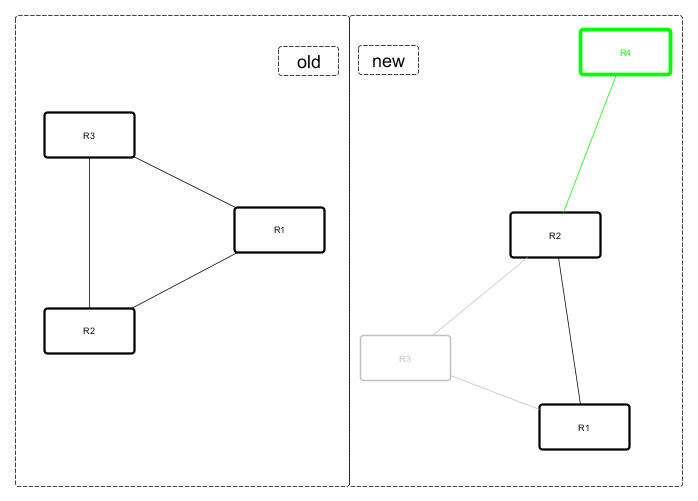
R3 and its links are missing - highlighted in gray, but R4 and its link is new - highlighted in green.
API reference
API reference for N2G yEd module.
- class N2G.plugins.diagrams.N2G_yEd.yed_diagram(node_duplicates='skip', link_duplicates='skip')
N2G yEd module allows to produce diagrams in yEd .graphml format.
Parameters
node_duplicates(str) can be of value skip, log, updatelink_duplicates(str) can be of value skip, log, update
- add_link(source, target, label='', src_label='', trgt_label='', description='', attributes=None, url='', link_id=None)
Method to add link between nodes.
Parameters
source(str) mandatory, id of source nodetarget(str) mandatory, id of target nodelabel(str) label at the center of the edge, by default equal to id attributesrc_label(str) label to display at the source end of the edgetrgt_label(str) label to display at target end of the edgedescription(str) string to save as linkdescriptionattributeurl(str) string to save as linkurlattributeattributes(dict) dictionary of yEd graphml tag names and attributeslink_id(str or int) optional link id value, must be unique across all links
Attributes dictionary keys will be used as xml tag names and values dictionary will be used as xml tag attributes, example:
{
    "LineStyle": {"color": "#00FF00", "width": "1.0"},
    "EdgeLabel": {"textColor": "#00FF00"},
}
Note
If source or target nodes does not exists, they will be automatically created
- add_node(id, **kwargs)
Convenience method to add node, by calling one of node add methods following these rules:
If
picattribute in kwargs,add_svg_nodeis calledIf
groupkwargs attribute equal to True,_add_group_nodecalledadd_shape_nodecalled otherwise
Parameters
id(str) mandatory, unique node identifier, usually equal to node name
- add_shape_node(id, label='', top_label='', bottom_label='', attributes=None, description='', shape_type='roundrectangle', url='', width=120, height=60, x_pos=200, y_pos=150, **kwargs)
Method to add node of type “shape”.
Parameters
id(str) mandatory, unique node identifier, usually equal to node namelabel(str) label at the center of the node, by default equal to id attributetop_label(str) label displayed at the top of the nodebottom_label(str) label displayed at the bottom of the nodedescription(str) string to save as nodedescriptionattributeshape_type(str) shape type, default - “roundrectangle”url(str) url string to save a nodeurlattributewidth(int) node width in pixelsheight(int) node height in pixelsx_pos(int) node position on x axisy_pos(int) node position on y axisattributes(dict) dictionary of yEd graphml tag names and attributes
Attributes dictionary keys will be used as xml tag names and values dictionary will be used as xml tag attributes, example:
{
    'Shape'     : {'type': 'roundrectangle'},
    'DropShadow': { 'color': '#B3A691', 'offsetX': '5', 'offsetY': '5'}
}
- add_svg_node(pic, id, pic_path='./Pics/', label='', attributes=None, description='', url='', width=50, height=50, x_pos=200, y_pos=150, **kwargs)
Method to add SVG picture as node by loading SVG file content into graphml
Parameters
id(str) mandatory, unique node identifier, usually equal to node namepic(str) mandatory, name of svg filepic_path(str) OS path to SVG file folder, default is./Pics/label(str) label displayed above SVG node, if not provided, label set equal to iddescription(str) string to save as nodedescriptionattributeurl(str) url string to save as nodeurlattributewidth(int) node width in pixelsheight(int) node height in pixelsx_pos(int) node position on x axisy_pos(int) node position on y axisattributes(dict) dictionary of yEd graphml tag names and attributes
Attributes dictionary keys will be used as xml tag names and values dictionary will be used as xml tag attributes, example:
{
    'DropShadow': { 'color': '#B3A691', 'offsetX': '5', 'offsetY': '5'}
}
- compare(data, missing_nodes=None, new_nodes=None, missing_links=None, new_links=None)
Method to combine two graphs - existing and new - and produce resulting graph following these rules:
nodes and links present in new graph but not in existing graph considered as new and will be updated with
new_nodesandnew_linksattributes by default highlighting them in greennodes and links missing from new graph but present in existing graph considered as missing and will be updated with
missing_nodesandmissing_linksattributes by default highlighting them in graynodes and links present in both graphs will remain unchanged
Parameters
data(dict) dictionary containing new graph data, dictionary format should be the same as forfrom_dictmethod.missing_nodes(dict) dictionary with attributes to apply to missing nodesnew_nodes(dict) dictionary with attributes to apply to new nodesmissing_links(dict) dictionary with attributes to apply to missing linksnew_links(dict) dictionary with attributes to apply to new links
Sample usage:
from N2G import yed_diagram
diagram = yed_diagram()
new_graph = {
    'nodes': [
        {'id': 'a', 'pic': 'router_round', 'label': 'R1' }
    ],
    'edges': [
        {'source': 'f', 'src_label': 'Gig0/21', 'label': 'DF', 'target': 'b'}
    ]
}
diagram.from_file("./old_graph.graphml")
diagram.compare(new_graph)
diagram.dump_file(filename="compared_graph.graphml")
- delete_link(id=None, ids=None, label='', src_label='', trgt_label='', source='', target='')
Method to delete link by its id. Bulk delete operation supported by providing list of link ids to delete.
If link
idoridsnot provided, id calculated based on -label, src_label, trgt_label, source, target- attributes using this algorithm:Edge tuple produced:
tuple(sorted([label, src_label, trgt_label, source, target]))MD5 hash derived from tuple:
hashlib.md5(",".join(edge_tup).encode()).hexdigest()
Parameters
id(str) id of single link to deleteids(list) list of link ids to deletelabel(str) link label to calculate id of single link to deletesrc_label(str) link source label to calculate id of single link to deletetrgt_label(str) link target label to calculate id of single link to deletesource(str) link source to calculate id of single link to deletetarget(str) link target to calculate id of single link to delete
- delete_node(id=None, ids=None)
Method to delete node by its id. Bulk delete operation supported by providing list of node ids to delete.
Parameters
id(str) id of single node to deleteids(list) list of node ids to delete
- dump_file(filename=None, folder='./Output/')
Method to save current diagram in .graphml file.
Parameters
filename(str) name of the file to save diagram intofolder(str) OS path to folder where to save diagram file
If no
filenameprovided, timestamped format will be used to produce filename, e.g.:Sun Jun 28 20-30-57 2020_output.graphml
- dump_xml()
Method to return current diagram XML text
- from_csv(text_data)
Method to build graph from CSV tables
Parameters
text_data(str) CSV text with links or nodes details
This method supports loading CSV text data that contains nodes or links information. If
idin headers,from_dictmethod will be called for CSV processing,from_listmethod will be used otherwise.CSV data with nodes details should have headers matching add node methods arguments and rules.
CSV data with links details should have headers matching
add_linkmethod arguments and rules.Sample CSV table with link details:
"source","src_label","label","target","trgt_label","description"
"a","Gig0/0","DF","b","Gig0/1","vlans_trunked: 1,2,3"
"b","Gig0/0","Copper","c","Gig0/2",
"b","Gig0/0","Copper","e","Gig0/2",
d,Gig0/21,FW,e,Gig0/23,
Sample CSV table with node details:
"id","pic","label","bottom_label","top_label","description"
a,router_1,"R1,2",,,
"b",,,"some","top_some",
"c",,"somelabel","botlabel","toplabel","some node description"
"d","firewall.svg","somelabel1",,,"some node description"
"e","router_2","R1",,,
- from_dict(data)
Method to build graph from dictionary.
Parameters
data(dict) dictionary with nodes and link/edges details.
Example
datadictionary:sample_graph = { 'nodes': [ { 'id': 'a', 'pic': 'router', 'label': 'R1' }, { 'id': 'b', 'label': 'somelabel', 'bottom_label':'botlabel', 'top_label':'toplabel', 'description': 'some node description' }, { 'id': 'e', 'label': 'E' } ], 'edges': [ { 'source': 'a', 'src_label': 'Gig0/0', 'label': 'DF', 'target': 'b', 'trgt_label': 'Gig0/1', 'description': 'vlans_trunked: 1,2,3' } ], 'links': [ { 'source': 'a', 'target': 'e' } ] }
Dictionary Content Rules
dictionary may contain
nodeskey with a list of nodes dictionarieseach node dictionary must contain unique
idattribute, other attributes are optionaldictionary may contain
edgesorlinkskey with a list of edges dictionarieseach link dictionary must contain
sourceandtargetattributes, other attributes are optional
- from_file(filename, file_load='xml')
Method to load data from file for processing. File format can be yEd graphml (XML) or CSV
Parameters
filename(str) OS path to file to loadfile_load(str) indicated the load of the file, supportsxml,csv
- from_list(data)
Method to build graph from list.
Parameters
data(list) list of link dictionaries,
Example
datalist:sample_graph = [ { 'source': 'a', 'src_label': 'Gig0/0\nUP', 'label': 'DF', 'target': 'b', 'trgt_label': 'Gig0/1', 'description': 'vlans_trunked: 1,2,3\nstate: up' }, { 'source': 'a', 'target': { 'id': 'e', 'label': 'somelabel', 'bottom_label':'botlabel', 'top_label':'toplabel', 'description': 'some node description' } } } ]
List Content Rules
each list item must have
targetandsourceattributes definedtarget/sourceattributes can be either a string or a dictionarydictionary
target/sourcenode must containidattribute and other supported node attributes
Note
By default yed_diagram object
node_duplicatesaction set to ‘skip’ meaning that node will be added on first occurrence and ignored after that. Setnode_duplicatesto ‘update’ if node with given id need to be updated by later occurrences in the list.
- from_xml(text_data)
Method to load yEd graphml XML formatted text for processing
Parameters
text_data(str) text data to load
- layout(algo='kk', width=1360, height=864, **kwargs)
Method to calculate graph layout using Python igraph library
Parameters
algo(str) name of layout algorithm to use, default is ‘kk’. Reference Layout algorithms table below for valid algo nameswidth(int) width in pixels to fit layout inheight(int) height in pixels to fit layout inkwargsany additional kwargs to pass to igraphGraph.layoutmethod
Layout algorithms
algo name
description
circle, circular
Deterministic layout that places the vertices on a circle
drl
The Distributed Recursive Layout algorithm for large graphs
fr
Fruchterman-Reingold force-directed algorithm
fr3d, fr_3d
Fruchterman-Reingold force-directed algorithm in three dimensions
grid_fr
Fruchterman-Reingold force-directed algorithm with grid heuristics for large graphs
kk
Kamada-Kawai force-directed algorithm
kk3d, kk_3d
Kamada-Kawai force-directed algorithm in three dimensions
large, lgl, large_graph
The Large Graph Layout algorithm for large graphs
random
Places the vertices completely randomly
random_3d
Places the vertices completely randomly in 3D
rt, tree
Reingold-Tilford tree layout, useful for (almost) tree-like graphs
rt_circular, tree
Reingold-Tilford tree layout with a polar coordinate post-transformation, useful for (almost) tree-like graphs
sphere, spherical, circular_3d
Deterministic layout that places the vertices evenly on the surface of a sphere
- set_attributes(element, attributes=None)
Method to set attributes for XML element
Parameters
element(object) xml etree element object to set attributes forattributes(dict) dictionary of yEd graphml tag names and attributes
Attributes dictionary keys will be used as xml tag names and values dictionary will be used as xml tag attributes, example:
{
    "LineStyle": {"color": "#00FF00", "width": "1.0"},
    "EdgeLabel": {"textColor": "#00FF00"},
}
- update_link(edge_id='', label='', src_label='', trgt_label='', source='', target='', new_label=None, new_src_label=None, new_trgt_label=None, description='', attributes=None)
Method to update edge/link details.
Parameters
edge_id(str) md5 hash edge id, if not provided, will be generated based on edge attributeslabel(str) existing edge labelsrc_label(str) existing edge src_labeltrgt_label(str) existing edge tgt_labelsource(str) existing edge source node IDtarget(str) existing edge target node idnew_label(str) new edge labelnew_src_label(str) new edge src_labelnew_trgt_label(str) new edge tgt_labeldescription(str) new edge descriptionattributes(str) dictionary of attributes to apply to edge element
Either of these must be provided to find edge element to update:
edge_idMD5 hash orlabel, src_label, trgt_label, source, targetattributes to calculateedge_id
edge_idcalculated based on -label, src_label, trgt_label, source, target- attributes following this algorithm:Edge tuple produced:
tuple(sorted([label, src_label, trgt_label, source, target]))MD5 hash derived from tuple:
hashlib.md5(",".join(edge_tup).encode()).hexdigest()
This method will replace existing and add new labels to the link.
Existing description attribute will be replaced with new value.
Attributes will replace existing values.
- update_node(id, label=None, top_label=None, bottom_label=None, attributes=None, description=None, width='', height='')
Method to update node details
Parameters
id(str) mandatory, unique node identifier, usually equal to node namelabel(str) label at the center of the shape node or above SVG nodetop_label(str) label displayed at the top of the nodebottom_label(str) label displayed at the bottom of the nodedescription(str) string to save as nodedescriptionattributewidth(int) node width in pixelsheight(int) node height in pixelsattributes(dict) dictionary of yEd graphml tag names and attributes
Attributes dictionary keys will be used as xml tag names and values dictionary will be used as xml tag attributes, example:
{
    'Shape'     : {'type': 'roundrectangle'},
    'DropShadow': { 'color': '#B3A691', 'offsetX': '5', 'offsetY': '5'}
}
This method will replace existing and add new labels to the node.
Existing description attribute will be replaced with new value.
Height and width will override existing values.
Attributes will replace existing values.