V3D Diagram Plugin
Module to produce JSON structure compatible with 3D Force-Directed Graph library JSON input syntax
Why? Because network 3D visualisation is awesome. However, author is not aware of complete application that is capable of displaying produced results utilizing 3D Force-Directed Graph library. There is an attempt to make such an application described in Built-in Diagram Viewer section, but it is very (very) far from being perfect. Hence, if you are aware of better option to visualize data compatible with JSON input syntax please let the author know about it.
Quick start
Nodes and links can be added one by one using add_node and add_link methods
from N2G import v3d_diagramm as create_v3d_diagram

v3d_drawing = create_v3d_diagram()
v3d_drawing.add_node(id="node-1")
v3d_drawing.add_node(id="node-2")
v3d_drawing.add_link("node-1", "node-2", label="link 1")
v3d_drawing.dump_file()
After opening and editing produced JSON text file, it might look like this:
{
    "nodes": [
        {
            "id": "node-1",
            "label": "node-1",
            "color": "green",
            "nodeResolution": 8,
            "data": {}
        },
        {
            "id": "node-2",
            "label": "node-2",
            "color": "green",
            "nodeResolution": 8,
            "data": {}
        }
    ],
    "links": [
        {
            "id": "b35ebf8a6eeb7084dd9f3e14ec85eb9c",
            "label": "bla1",
            "source": "node-1",
            "target": "node-2",
            "src_label": "",
            "trgt_label": "",
            "data": {}
        }
    ]
}
Nodes and links default attributes
Node dictionaries have these attributes added by default:
id- node unique identifierlabel- node label to displaycolor- node color, default is greennodeResolution- how smooth node sphere is, default value is 8data- data dictionary
Link dictionaries have these attributes added by default:
source- source node idtarget- target node idid- link unique identifier, calculated automatically if not suppliedlabel- link labeldata- data dictionarysrc_label- link label to use next to source nodetrgt_label- link label to use next to target node
Loading graph from dictionary
Graph can be loaded from dictionary data using from_dict method, sample code:
from N2G import v3d_diagramm as create_v3d_diagram

sample_data = {
    'links': [{'data': {}, 'label': 'bla1', 'source': 'node-1', 'src_label': '', 'target': 'node-2', 'trgt_label': ''},
              {'data': {}, 'label': 'bla2', 'source': 'node-1', 'src_label': '', 'target': 'node-3', 'trgt_label': ''},
              {'data': {}, 'label': 'bla3', 'source': 'node-3', 'src_label': '', 'target': 'node-5', 'trgt_label': ''},
              {'data': {}, 'label': 'bla4', 'source': 'node-3', 'src_label': '', 'target': 'node-4', 'trgt_label': ''},
              {'data': {}, 'label': 'bla77', 'source': 'node-33', 'src_label': '', 'target': 'node-44', 'trgt_label': ''},
              {'data': {'cd': 123, 'ef': 456}, 'label': 'bla6', 'source': 'node-6', 'src_label': '', 'target': 'node-1', 'trgt_label': ''}],
    'nodes': [{'color': 'green', 'data': {}, 'id': 'node-1', 'label': 'node-1', 'nodeResolution': 16},
              {'color': 'green', 'data': {}, 'id': 'node-2', 'label': 'node-2', 'nodeResolution': 8},
              {'color': 'blue', 'data': {'val': 4}, 'id': 'node-3', 'label': 'node-3', 'nodeResolution': 8},
              {'color': 'green', 'data': {}, 'id': 'node-4', 'label': 'node-4', 'nodeResolution': 8},
              {'color': 'green', 'data': {}, 'id': 'node-5', 'label': 'node-5', 'nodeResolution': 8},
              {'color': 'green', 'data': {'a': 'b', 'c': 'd'}, 'id': 'node-6', 'label': 'node-6', 'nodeResolution': 8},
              {'color': 'green', 'data': {}, 'id': 'node-33', 'label': 'node-33', 'nodeResolution': 8},
              {'color': 'green', 'data': {}, 'id': 'node-44', 'label': 'node-44', 'nodeResolution': 8},
              {'color': 'green', 'data': {}, 'id': 'node-25', 'label': 'node-25', 'nodeResolution': 8}]
}

v3d_drawing = create_v3d_diagram()
v3d_drawing.from_dict(sample_data)
v3d_drawing.dump_file()
Loading graph from list
Graph can be loaded from list data using from_list method, sample code:
from N2G import v3d_diagramm as create_v3d_diagram

sample_data_list = [
    {'data': {}, 'label': 'bla1', 'source': {'id': 'node-1', 'nodeResolution': 16}, 'src_label': '', 'target': {'id': 'node-2'}, 'trgt_label': ''},
    {'data': {}, 'label': 'bla2', 'source': 'node-1', 'src_label': '', 'target': 'node-3', 'trgt_label': ''},
    {'data': {}, 'label': 'bla3', 'source': {'id': 'node-3'}, 'src_label': '', 'target': 'node-5', 'trgt_label': ''},
    {'data': {}, 'label': 'bla4', 'source': {'id': 'node-3', 'data': {'val': 4}}, 'src_label': '', 'target': 'node-4', 'trgt_label': ''},
    {'data': {}, 'label': 'bla77', 'source': 'node-33', 'src_label': '', 'target': 'node-44', 'trgt_label': ''},
    {'data': {'cd': 123, 'ef': 456}, 'label': 'bla6', 'source': {'id': 'node-6', 'data': {'a': 'b', 'c': 'd'}}, 'src_label': '', 'target': 'node-1', 'trgt_label': ''}
]

v3d_drawing = create_v3d_diagram()
v3d_drawing.from_list(sample_data_list)
v3d_drawing.dump_file()
Loading existing diagrams
Existing JSON input syntax data can be loaded into V3D plugin for processing and manipulation using sample code:
from N2G import v3d_diagramm as create_v3d_diagram

data = '''{
    "nodes": [
        {
        "id": "id1",
        "name": "name1",
        "val": 1
        },
        {
        "id": "id2",
        "name": "name2",
        "val": 10
        }
    ],
    "links": [
        {
            "source": "id1",
            "target": "id2"
        }
    ]
}'''

v3d_drawing = create_v3d_diagram()
v3d_drawing.from_v3d_json(data)
Diagram layout
To arrange diagram nodes in certain way one can use layout method that relies on
igraph library to calculate
node coordinates in accordance with certain algorithm. List of supported layout algorithms
and their details can be found here
together with brief description in API Reference section.
Sample code to layout diagram:
from N2G import v3d_diagramm as create_v3d_diagram

sample_data_list = [
    {'data': {}, 'label': 'bla1', 'source': {'id': 'node-1', 'nodeResolution': 16}, 'src_label': '', 'target': {'id': 'node-2'}, 'trgt_label': ''},
    {'data': {}, 'label': 'bla2', 'source': 'node-1', 'src_label': '', 'target': 'node-3', 'trgt_label': ''},
    {'data': {}, 'label': 'bla3', 'source': {'id': 'node-3'}, 'src_label': '', 'target': 'node-5', 'trgt_label': ''},
    {'data': {}, 'label': 'bla4', 'source': {'id': 'node-3', 'data': {'val': 4}}, 'src_label': '', 'target': 'node-4', 'trgt_label': ''},
    {'data': {}, 'label': 'bla77', 'source': 'node-33', 'src_label': '', 'target': 'node-44', 'trgt_label': ''},
    {'data': {'cd': 123, 'ef': 456}, 'label': 'bla6', 'source': {'id': 'node-6', 'data': {'a': 'b', 'c': 'd'}}, 'src_label': '', 'target': 'node-1', 'trgt_label': ''}
]

v3d_drawing = create_v3d_diagram()
v3d_drawing.from_list(sample_data_list)
v3d_drawing.layout(algo='kk3d', dx=200, dy=200, dz=200)
Where dx, dy and dz help to set diagram 3d size.
Built-in Diagram Viewer
V3D plugin comes with simple 3d diagram viewer for the purpose of demonstration and to explore produced diagram.
Built in WEB server uses Flask in debug mode, hence not suitable for production use.
To install Flask WEB framework - pip install Flask
Sample code to run built-in WEB server:
from N2G import v3d_diagramm as create_v3d_diagram
sample_data_list = [
{'data': {}, 'label': 'bla1', 'source': {'id': 'node-1', 'nodeResolution': 16}, 'src_label': '', 'target': {'id': 'node-2'}, 'trgt_label': ''},
{'data': {}, 'label': 'bla2', 'source': 'node-1', 'src_label': '', 'target': 'node-3', 'trgt_label': ''},
{'data': {}, 'label': 'bla3', 'source': {'id': 'node-3'}, 'src_label': '', 'target': 'node-5', 'trgt_label': ''},
{'data': {}, 'label': 'bla4', 'source': {'id': 'node-3', 'data': {'val': 4}}, 'src_label': '', 'target': 'node-4', 'trgt_label': ''},
{'data': {}, 'label': 'bla77', 'source': 'node-33', 'src_label': '', 'target': 'node-44', 'trgt_label': ''},
{'data': {'cd': 123, 'ef': 456}, 'label': 'bla6', 'source': {'id': 'node-6', 'data': {'a': 'b', 'c': 'd'}}, 'src_label': '', 'target': 'node-1', 'trgt_label': ''}
]
v3d_drawing = create_v3d_diagram()
v3d_drawing.from_list(sample_data_list)
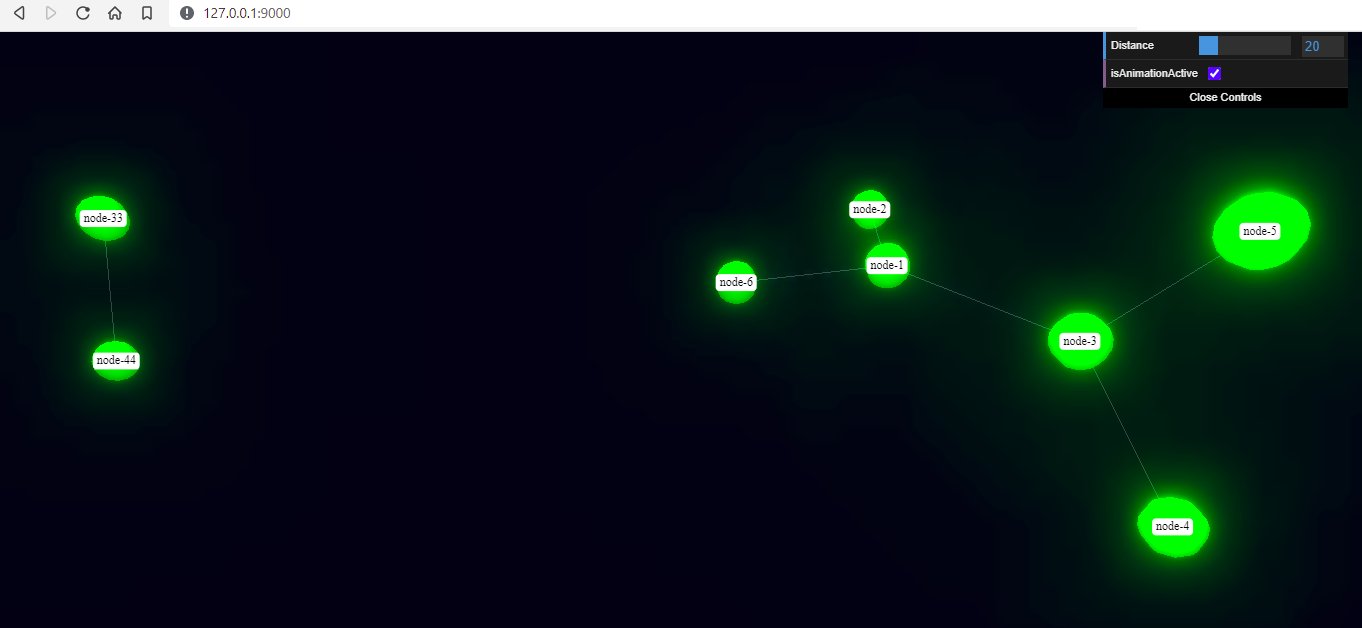
v3d_drawing.run(ip="0.0.0.0", "port"=9000)
If all good, browsing to http://127.0.0.1:9000 URL should load similar to below 3D diagram:
API reference
API reference for N2G V3D module.
- class N2G.plugins.diagrams.N2G_V3D.v3d_diagramm(node_duplicates='skip', link_duplicates='skip')
Class to produce JSON data structure compatible with 3D Force-Directed Graph library JSON input syntax
- Parameters
node_duplicates – (str) what to do with node duplicates -
skip(default),updateorloglink_duplicates – (str) what to do with link duplicates -
skip(default),updateorlog
- add_link(source, target, label='', src_label='', trgt_label='', data=None, id=None, **kwargs)
Method to add link between nodes.
- Parameters
source – (str) mandatory, source node id
target – (str) mandatory, target node id
label – (str) link label to display at the center of the link
data – (dict) dictionary of key value pairs to add as link data
src_label – (str) link label to use next to source node
trgt_label – (str) link label to use next to target node
id – (str) explicit link identifier to use
kwargs – (dict) any additional kwargs to add to link dictionary
Note
If source or target nodes does not exists, they will be automatically created
All labels are optional and substituted with empty values to calculate link id.
By default V3D uses below code to produce MD5 hash digest for link id:
link_tup = tuple(sorted([label, source, target, src_label, trgt_label]))
link_id = hashlib.md5(",".join(edge_tup).encode()).hexdigest()
- add_node(id, label='', data=None, color='green', nodeResolution=8, **kwargs)
Method to add node to the diagram.
- Parameters
id – (str) mandatory, unique node identifier, usually equal to node name
label – (str) node label, if not provided, set equal to id
data – (dict) dictionary of key value pairs to add as node data
fx – (int) node position on x axis
fy – (int) node position on y axis
fz – (int) node position on z axis
color – (str) node color e.g.
blue, default isgreennodeResolution – (int) geometric resolution of the node, expressed in how many slice segments to divide the circumference. Higher values yield smoother spheres.
kwargs – (dict) any additional kwargs to add to node dictionary as per node styling attributes such as
nodeRelSize,nodeOpacity,nodeValetc.
- delete_link(source=None, target=None, label='', src_label='', trgt_label='', id=None)
Method to delete link. Uses link
idto search for link to delete, if noidprovided usessource, target, label, src_label, trgt_labelto calculate edge id.- Parameters
source – (str) source node id
target – (str) target node id
label – (str) existing link label
src_label – (str) link source label
trgt_label – (str) link target label
id – (str) link identifier to find the link to delete
- delete_node(id)
Method to delete node. Uses node
idto search for node to delete.- Parameters
id – (str) mandatory, unique node identifier
- dump_dict()
Method to populate
self.drawingdictionary with current links and nodes items, returnself.drawingdictionary content after that.
- dump_file(filename=None, folder='./Output/', json_kwargs=None)
Method to save current diagram to text file in a JSON format.
- Parameters
filename – (str) name of the file to save diagram into
folder – (str) OS path to folder where to save diagram file, default is
./Output/json_kwargs – (dict) kwargs to use with
json.dumpsmethod
If no
filenameprovided, timestamped format used to produce filename, e.g.:Sun Jun 28 20-30-57 2020_output.txt
- dump_json(**kwargs)
Method to transform graph data in a JSON formatted string.
- Parameters
kwargs – (dict) kwargs to use with
json.dumpsmethod
- from_dict(data)
Method to build graph from dictionary.
- Parameters
data – (dict) dictionary with nodes and link/edges details
Sample data dictionary:
sample_graph = {
    'nodes': [
        {
            'id': 'a',
            'label': 'R1'
        },
        {
            'id': 'b',
            'label': 'somelabel',
            'data': {'description': 'some node description'}
        },
        {
            'id': 'e',
            'label': 'E'
        }
    ],
    'edges': [
        {
            'source': 'a',
            'label': 'DF',
            'src_label': 'Gi1/1',
            'trgt_label': 'Gi2/2',
            'target': 'b',
            'url': 'google.com'
        }
    ],
    'links': [
        {
            'source': 'a',
            'target': 'e'
        }
    ]
}
Dictionary Content Rules
dictionary may contain
nodeskey with a list of nodes dictionarieseach node dictionary must contain unique
idattribute, other attributes are optionaldictionary may contain
edgesorlinkskey with a list of edges dictionarieseach link dictionary must contain
sourceandtargetattributes, other attributes are optional
- from_list(data)
Method to build graph from list.
- Parameters
data – (list) list of link dictionaries
Sample list data:
sample_graph = [
    {
        'source': 'a',
        'label': 'DF',
        'src_label': 'Gi1/1',
        'trgt_label': 'Gi2/2',
        'target': 'b',
        'data': {'vlans': 'vlans_trunked: 1,2,3\nstate: up'}
    },
    {
        'source': 'a',
        'target': {
                'id': 'e',
                'label': 'somelabel',
                'data': {'description': 'some node description'}
            }
        }
    }
]
List Content Rules
each list item must have
targetandsourceattributes definedtarget/sourceattributes can be either a string or a dictionarydictionary
target/sourcenode must containidattribute and other supported node attributes
Note
By default drawio_diagram object
node_duplicatesaction set to ‘skip’ meaning that node will be added on first occurrence and ignored after that. Setnode_duplicatesto ‘update’ if node with given id need to be updated by later occurrences in the list.
- from_v3d_json(data)
Method to load JSON input syntax data into diagram plugin, presumably to perform various manipulations.
- Parameters
data –
(str) string of JSON input syntax format
- layout(algo='kk3d', dx=100, dy=100, dz=100, **kwargs)
Method to calculate graph layout using Python igraph library
- Parameters
algo – (str) name of igraph layout algorithm to use, default is ‘kk3d’. Reference Layout algorithms table below for valid algo names
kwargs – (dict) any additional kwargs to pass to igraph
Graph.layoutmethod
Layout algorithms
algo name
description
circle, circular
Deterministic layout that places the vertices on a circle
drl
The Distributed Recursive Layout algorithm for large graphs
fr
Fruchterman-Reingold force-directed algorithm
fr3d, fr_3d
Fruchterman-Reingold force-directed algorithm in three dimensions
grid_fr
Fruchterman-Reingold force-directed algorithm with grid heuristics for large graphs
kk
Kamada-Kawai force-directed algorithm
kk3d, kk_3d
Kamada-Kawai force-directed algorithm in three dimensions
large, lgl, large_graph
The Large Graph Layout algorithm for large graphs
random
Places the vertices completely randomly
random_3d
Places the vertices completely randomly in 3D
rt, tree
Reingold-Tilford tree layout, useful for (almost) tree-like graphs
rt_circular, tree
Reingold-Tilford tree layout with a polar coordinate post-transformation, useful for (almost) tree-like graphs
sphere, spherical, circular_3d
Deterministic layout that places the vertices evenly on the surface of a sphere
Note
if 2d layout algorithm called, z axis coordinate set to 0
- run(ip: str = '0.0.0.0', port: int = 9000, debug: bool = True, dry_run: bool = False) None
Method to run FLASK web server using built-in browser app.
- Parameters
ip – IP address to bound WEB server to
port – port number to run WEB server on
debug – If True run Flask server in debug mode
dry_run – (bool) if True, do not start, return status info instead
- update_link(source=None, target=None, label='', src_label='', trgt_label='', new_label='', new_src_label='', new_trgt_label='', data=None, url='', id=None, **kwargs)
Method to update link details. Uses link
idto search for link to update, if noidprovided usessource, target, label, src_label, trgt_labelto calculate edge id.- Parameters
source – (str) source node id
target – (str) target node id
label – (str) existing link label
src_label – (str) existing link source label
trgt_label – (str) existing link target label
new_label – (str) new link label to replace existing label
new_src_label – (str) new link source label to replace existing source label
new_trgt_label – (str) new link target label to replace existing target label
data – (dict) dictionary of key value pairs to update link data
url – (str) url string to save as link
urlattributeid – (str) link identifier to find the link to update
kwargs – (dict) any additional kwargs to update link dictionary
- update_node(id, data=None, **kwargs)
Method to update node details. Uses node
idto search for node to update- Parameters
id – (str) mandatory, unique node identifier
data – (dict) data argument/key dictionary content to update existing values
kwargs – (dict) any additional arguments to update node dictionary