DrawIo Diagram Plugin
N2G Drawio Module supports producing XML structured text files that can be opened by Diagrams DrawIO desktop or DrawIO web applications
Quick start
Nodes and links can be added one by one using add_node and add_link methods
from N2G import drawio_diagram

diagram = drawio_diagram()
diagram.add_diagram("Page-1")
diagram.add_node(id="R1")
diagram.add_node(id="R2")
diagram.add_link("R1", "R2", label="DF", src_label="Gi1/1", trgt_label="GE23")
diagram.layout(algo="kk")
diagram.dump_file(filename="Sample_graph.drawio", folder="./Output/")
After opening and editing diagram, it might look like this:
Working with drawio module should be started with adding new diagram, after that nodes and links can be added. It is possible to switch between diagrams to edit using go_to_diagram method.
Note
link src_label and trgt_label attributes supported starting with 0.2.0 version
Adding styles
Styles used to change the way how things look and can be applied to nodes or links. Styles attributes in DrawIO encoded using strings similar to this one:
shape=mxgraph.cisco.misc.asr_1000_series;html=1;pointerEvents=1;dashed=0;fillColor=#036897;strokeColor=#ffffff;strokeWidth=2;verticalLabelPosition=bottom;verticalAlign=top;align=center;outlineConnect=0;
above strings can be found in node and link settings:
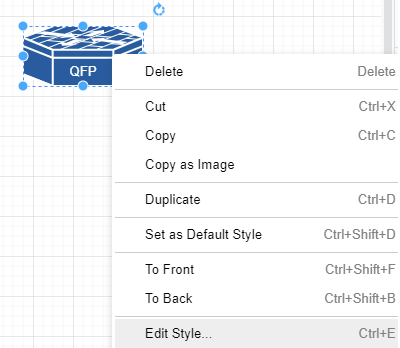
and can be used to reference by node and links style attribute, additionally, style string can be saved in text file and style attribute can reference that file OS path location.
from N2G import drawio_diagram

new_link_style="endArrow=classic;fillColor=#f8cecc;strokeColor=#FF3399;dashed=1;edgeStyle=entityRelationEdgeStyle;startArrow=diamondThin;startFill=1;endFill=0;strokeWidth=5;"
building_style="shape=mxgraph.cisco.buildings.generic_building;html=1;pointerEvents=1;dashed=0;fillColor=#036897;strokeColor=#ffffff;strokeWidth=2;verticalLabelPosition=bottom;verticalAlign=top;align=center;outlineConnect=0;"

diagram = drawio_diagram()
diagram.add_diagram("Page-1")
diagram.add_node(id="HQ", style=building_style, width=90, height=136)
diagram.add_node(id="R1", style="./styles/router.txt")
diagram.add_link("R1", "HQ", label="DF", style=new_link_style)
where ./styles/router.txt content is:
shape=mxgraph.cisco.routers.atm_router;html=1;pointerEvents=1;dashed=0;fillColor=#036897;strokeColor=#ffffff;strokeWidth=2;verticalLabelPosition=bottom;verticalAlign=top;align=center;outlineConnect=0;
After opening and editing diagram, it might look like this:
Note
DrawIO does not encode node width and height attributes in style string, as a result width and height should be provided separately or will be set to default values: 120 and 60 pixels
Nodes and links data attributes
Data and URL attributes can be added to links and nodes to encode additional information. Data attribute should be a dictionary of key value pairs to add, where values can be of type string only.
URL attribute can point to WEB link or can reference another diagram/tab name.
from N2G import drawio_diagram

diagram = drawio_diagram()
diagram.add_diagram("Page-1")
diagram.add_node(id="R1", data={"a": "b", "c": "d"}, url="http://google.com")
diagram.add_diagram("Page-2")
diagram.add_node(id="R2", url="Page-1")
diagram.add_node(id="R3")
diagram.add_link("R2", "R3", label="uplink", data={"speed": "1G", "media": "10G-LR"}, url="http://cmdb.local")
diagram.dump_file(filename="Sample_graph.drawio", folder="./Output/")
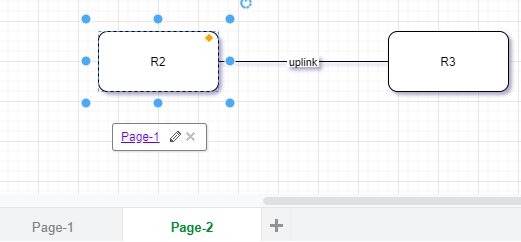
After opening and editing diagram, it might look like this:
Loading graph from dictionary
Diagram elements can be loaded from dictionary structure. That dictionary may contain nodes, links and edges keys, these keys should contain list of dictionaries where each dictionary item will contain element attributes such as id, labels, data, url etc.
from N2G import drawio_diagram

diagram = drawio_diagram()
sample_graph={
'nodes': [
    {'id': 'a', 'style': './styles/router.txt', 'label': 'R1', 'width': 78, 'height': 53},
    {'id': 'R2', 'label':'CE12800'},
    {'id': 'c', 'label': 'R3', 'data': {'role': 'access', 'make': 'VendorX'}}
],
'links': [
    {'source': 'a', 'label': 'DF', 'target': 'R2', 'data': {'role': 'uplink'}},
    {'source': 'R2', 'label': 'Copper', 'target': 'c'},
    {'source': 'c', 'label': 'ZR', 'target': 'a'}
]}
diagram.from_dict(sample_graph, width=300, height=200, diagram_name="Page-2")
diagram.layout(algo="kk")
diagram.dump_file(filename="Sample_graph.drawio", folder="./Output/")
After opening and editing diagram, it might look like this:
Loading graph from list
From list method allows to load graph from list of dictionaries, generally containing link details like source, target, label. Additionally source and target can be defined using dictionaries as well, containing nodes details.
Note
Non-existing node will be automatically added on first encounter, by default later occurrences of same node will not lead to node attributes change, that behavior can be changed setting node_duplicates drawio_diagram attribute equal to update value.
from N2G import drawio_diagram

diagram = drawio_diagram()
sample_list_graph = [
    {'source': {'id': 'SW1'}, 'target': 'R1', 'label': 'Gig0/1--Gi2'},
    {'source': 'R2', 'target': 'SW1', "data": {"speed": "1G", "media": "10G-LR"}},
    {'source': {'id':'a', 'label': 'R3'}, 'target': 'SW1'},
    {'source': 'SW1', 'target': 'R4'}
]
diagram.from_list(sample_list_graph, width=300, height=200, diagram_name="Page-2")
diagram.layout(algo="kk")
diagram.dump_file(filename="Sample_graph.drawio", folder="./Output/")
After opening and editing diagram, it might look like this:
Loading graph from csv
Similar to from_dict or from_list, from_csv method can take csv data with elements details and add them to diagram. Two types of csv table should be provided - one for nodes, another for links.
from N2G import drawio_diagram

diagram = drawio_diagram()
csv_links_data = """"source","label","target"
"a","DF","b"
"b","Copper","c"
"b","Copper","e"
d,FW,e
"""
csv_nodes_data=""""id","label","style","width","height"
a,"R12","./styles/router.txt",78,53
"b","R2",,,
"c","R3",,,
"d","SW22",,,
"e","R1",,,
"""
diagram.from_csv(csv_nodes_data)
diagram.from_csv(csv_links_data)
diagram.layout(algo="kk")
diagram.dump_file(filename="Sample_graph.drawio", folder="./Output/")
After opening and editing diagram, it might look like this:
Loading existing diagrams
N2G DrawIO module provides from_file and from_text methods to load existing diagram content, to load diagram from file one can use this as example:
from N2G import drawio_diagram

diagram = drawio_diagram()
diagram.from_file("./source/old_office_diagram.drawio")
After diagram loaded it can be modified or updated using add_x, from_x, delete_x or compare methods.
Diagram layout
To arrange diagram nodes in certain way one can use layout method that relies on igraph library to calculate node coordinates in accordance with certain algorithm. List of supported layout algorithms and their details can be found here together with brief description in API Reference section.
Sample code to layout diagram:
from N2G import drawio_diagram

diagram = drawio_diagram()
diagram.from_file("./source/old_office_diagram.graphml")
diagram.layout(algo="drl")
diagram.dump_file(filename="updated_office_diagram.graphml", folder="./Output/")
Comparing diagrams
Comparing diagrams can help to spot changes in your system. N2G compare method allow to calculate differences between old and new graphs and produce resulting diagram highlighting changes.
from N2G import drawio_diagram

diagram = drawio_diagram()
old_graph = {
'nodes': [
    {'id': 'R1'}, {'id': 'R2'}, {'id': 'R3'},
    ],
'edges': [
    {'source': 'R1', 'target': 'R2'},
    {'source': 'R2', 'target': 'R3'},
    {'source': 'R3', 'target': 'R1'}
]}
new_graph = {
'nodes': [
    {'id': 'R1'}, {'id': 'R2'}, {'id': 'R4'},
    ],
'edges': [
    {'source': 'R1', 'target': 'R2'},
    {'source': 'R2', 'target': 'R4'}
]}
diagram.add_diagram("Page-1", width=500, height=500)
diagram.from_dict(old_graph)
diagram.compare(new_graph)
diagram.layout(algo="kk")
diagram.dump_file(filename="Sample_graph.drawio", folder="./Output/")
Original and after diagrams combined:
R3 and its links are missing - highlighted in gray, but R4 and its link is new - highlighted in green.
API reference
API reference for N2G DrawIO module.
- class N2G.plugins.diagrams.N2G_DrawIO.drawio_diagram(node_duplicates='skip', link_duplicates='skip')
N2G DrawIO module allows to produce diagrams compatible with DrawIO XML format.
Parameters
node_duplicates(str) can be of value skip, log, updatelink_duplicates(str) can be of value skip, log, update
- add_diagram(id, name='', width=1360, height=864)
Method to add new diagram tab and switch to it.
Warning
This method must be called to create at list one diagram tab to work with prior to nodes and links can be added to the drawing calling
add_linkoradd_nodemethods.Parameters
id(str) id of the diagram, should be unique across other diagramsname(str) tab namewidth(int) width of diagram in pixelsheight(int) height of diagram in pixels
- add_link(source, target, style='', label='', data=None, url='', src_label='', trgt_label='', src_label_style='', trgt_label_style='', link_id=None, **kwargs)
Method to add link between nodes to the diagram.
Parameters
source(str) mandatory, source node idsource(str) mandatory, target node idlabel(str) link label to display at the center of the linkdata(dict) dictionary of key value pairs to add as link dataurl(str) url string to save as linkurlattributestyle(str) string or OS path to text file with style to apply to the linksrc_label(str) link label to display next to source nodetrgt_label(str) link label to display next to target nodesrc_label_style(str) source label style stringtrgt_label_style(str) target label style stringlink_id(str or int) optional link id value, must be unique across all links
Sample DrawIO style string for the link:
endArrow=classic;fillColor=#f8cecc;strokeColor=#FF3399;dashed=1;
edgeStyle=entityRelationEdgeStyle;startArrow=diamondThin;startFill=1;
endFill=0;strokeWidth=5;
Note
If source or target nodes does not exists, they will be automatically created
All labels are optional and substituted with empty values to calculate link id.
- add_node(id, label='', data=None, url='', style='', width=120, height=60, x_pos=200, y_pos=150, **kwargs)
Method to add node to the diagram.
Parameters
id(str) mandatory, unique node identifier, usually equal to node namelabel(str) node label, if not provided, set equal to iddata(dict) dictionary of key value pairs to add as node dataurl(str) url string to save as nodeurlattributewidth(int) node width in pixelsheight(int) node height in pixelsx_pos(int) node position on x axisy_pos(int) node position on y axisstyle(str) string containing DrawIO style parameters to apply to the node
Sample DrawIO style string for the node:
shape=mxgraph.cisco.misc.asr_1000_series;html=1;pointerEvents=1;
dashed=0;fillColor=#036897;strokeColor=#ffffff;strokeWidth=2;
verticalLabelPosition=bottom;verticalAlign=top;align=center;
outlineConnect=0;
- compare(data, diagram_name=None, missing_colour='#C0C0C0', new_colour='#00FF00')
Method to combine two graphs - existing and new - and produce resulting graph following these rules:
nodes and links present in new graph but not in existing graph considered as new and will be updated with
new_colourstyle attribute by default highlighting them in greennodes and links missing from new graph but present in existing graph considered as missing and will be updated with
missing_colourstyle attribute by default highlighting them in graynodes and links present in both graphs will remain unchanged
Parameters
data(dict) dictionary containing new graph data, dictionary format should be the same as forfrom_dictmethod.missing_colour(str) colour to apply to missing elementsnew_colour(str) colour to apply to new elements
Sample usage:
from N2G import drawio_diagram
existing_graph = {
    "nodes": [
        {"id": "node-1"},
        {"id": "node-2"},
        {"id": "node-3"}
],
    "links": [
        {"source": "node-1", "target": "node-2", "label": "bla1"},
        {"source": "node-2", "target": "node-3", "label": "bla2"},
    ]
}
new_graph = {
    "nodes": [
        {"id": "node-99"},
        {"id": "node-100", "style": "./Pics/router_1.txt", "width": 78, "height": 53},
    ],
    "links": [
        {"source": "node-2", "target": "node-3", "label": "bla2"},
        {"source": "node-99", "target": "node-3", "label": "bla99"},
        {"source": "node-100", "target": "node-99", "label": "bla10099"},
    ]
}
drawing = drawio_diagram()
drawing.from_dict(data=existing_graph)
drawing.compare(new_graph)
drawing.layout(algo="kk")
drawing.dump_file(filename="compared_graph.drawio")
- delete_link(id=None, ids=None, label='', source='', target='', src_label='', trgt_label='')
Method to delete link by its id. Bulk delete operation supported by providing list of link ids to delete.
If link
idoridsnot provided, id calculated based on -label, source, target- attributes using this algorithm:Edge tuple produced:
tuple(sorted([label, source, target]))MD5 hash derived from tuple:
hashlib.md5(",".join(edge_tup).encode()).hexdigest()
Parameters
id(str) id of single link to deleteids(list) list of link ids to deletelabel(str) link label to calculate id of single link to deletesource(str) link source to calculate id of single link to deletetarget(str) link target to calculate id of single link to deletesrc_label(str) link source label to calculate id of single link to deletetrgt_label(str) link target label to calculate id of single link to delete
- delete_node(id=None, ids=None)
Method to delete node by its id. Bulk delete operation supported by providing list of node ids to delete.
Parameters
id(str) id of single node to deleteids(list) list of node ids to delete
- dump_file(filename=None, folder='./Output/')
Method to save current diagram in .drawio file.
Parameters
filename(str) name of the file to save diagram intofolder(str) OS path to folder where to save diagram file
If no
filenameprovided, timestamped format will be used to produce filename, e.g.:Sun Jun 28 20-30-57 2020_output.drawio
- dump_xml()
Method to return current diagram XML text
- from_csv(text_data)
Method to build graph from CSV tables
Parameters
text_data(str) CSV text with links or nodes details
This method supports loading CSV text data that contains nodes or links information. If
idin headers,from_dictmethod will be called for CSV processing,from_listmethod will be used otherwise.CSV data with nodes details should have headers matching
add_nodemethod arguments and rules.CSV data with links details should have headers matching
add_linkmethod arguments and rules.Sample CSV table with links details:
"source","label","target","src_label","trgt_label"
"a","DF","b","Gi1/1","Gi2/2"
"b","Copper","c","Te2/1",
"b","Copper","e","","GE3"
"d","FW","e",,
Sample CSV table with nodes details:
"id","label","style","width","height"
a,"R1,2","./Pics/cisco_router.txt",78,53
"b","some",,,
"c","somelabel",,,
"d","somelabel1",,,
"e","R1",,,
- from_dict(data, diagram_name='Page-1', width=1360, height=864)
Method to build graph from dictionary.
Parameters
diagram_name(str) name of the diagram tab where to add links and nodes. Diagram tab will be created if it does not existswidth(int) diagram width in pixelsheight(int) diagram height in pixelsdata(dict) dictionary with nodes and link/edges details, example:sample_graph = { 'nodes': [ { 'id': 'a', 'label': 'R1' }, { 'id': 'b', 'label': 'somelabel', 'data': {'description': 'some node description'} }, { 'id': 'e', 'label': 'E' } ], 'edges': [ { 'source': 'a', 'label': 'DF', 'src_label': 'Gi1/1', 'trgt_label': 'Gi2/2', 'target': 'b', 'url': 'google.com' } ], 'links': [ { 'source': 'a', 'target': 'e' } ] }
Dictionary Content Rules
dictionary may contain
nodeskey with a list of nodes dictionarieseach node dictionary must contain unique
idattribute, other attributes are optionaldictionary may contain
edgesorlinkskey with a list of edges dictionarieseach link dictionary must contain
sourceandtargetattributes, other attributes are optional
- from_file(filename, file_load='xml')
Method to load nodes and links from Drawio diagram file for further processing
Args
filename - OS path to .drawio file to load
- from_list(data, diagram_name='Page-1', width=1360, height=864)
Method to build graph from list.
Parameters
diagram_name(str) name of the diagram tab where to add links and nodes. Diagram tab will be created if it does not existswidth(int) diagram width in pixelsheight(int) diagram height in pixelsdata(list) list of link dictionaries, example:sample_graph = [ { 'source': 'a', 'label': 'DF', 'src_label': 'Gi1/1', 'trgt_label': 'Gi2/2', 'target': 'b', 'data': {'vlans': 'vlans_trunked: 1,2,3\nstate: up'} }, { 'source': 'a', 'target': { 'id': 'e', 'label': 'somelabel', 'data': {'description': 'some node description'} } } } ]
List Content Rules
each list item must have
targetandsourceattributes definedtarget/sourceattributes can be either a string or a dictionarydictionary
target/sourcenode must containidattribute and other supported node attributes
Note
By default drawio_diagram object
node_duplicatesaction set to ‘skip’ meaning that node will be added on first occurrence and ignored after that. Setnode_duplicatesto ‘update’ if node with given id need to be updated by later occurrences in the list.
- from_xml(text_data)
Method to load graph from .drawio XML text produced by DrawIO
Args
text_data - text data to load
- go_to_diagram(diagram_name=None, diagram_index=None)
DrawIO supports adding multiple diagram tabs within single document. This method allows to switch between diagrams in different tabs. That way each tab can be updated separately.
Parameters
diagram_name(str) name of diagram tab to switch todiagram_index(int) index of diagram tab to switch to, will change to last tab if index is out of range. Index can be positive or negative number and follows Python list index behavior. For instance, index equal to “-1” we go to last tab, “0” will go to first tab
- layout(algo='kk', ig_kwargs=None, **kwargs)
Method to calculate graph layout using Python igraph library
Parameters
algo(str) name of layout algorithm to use, default is ‘kk’. Reference Layout algorithms table below for valid algo namesig_kwargs(dict) arguments to use to instantiate igraph’s Graph instance as per documentationkwargsany additional kwargs to pass to igraphGraph.layoutmethod as per documentation
Layout algorithms
algo name
description
circle, circular
Deterministic layout that places the vertices on a circle
drl
The Distributed Recursive Layout algorithm for large graphs
fr
Fruchterman-Reingold force-directed algorithm
fr3d, fr_3d
Fruchterman-Reingold force-directed algorithm in three dimensions
grid_fr
Fruchterman-Reingold force-directed algorithm with grid heuristics for large graphs
kk
Kamada-Kawai force-directed algorithm
kk3d, kk_3d
Kamada-Kawai force-directed algorithm in three dimensions
large, lgl, large_graph
The Large Graph Layout algorithm for large graphs
random
Places the vertices completely randomly
random_3d
Places the vertices completely randomly in 3D
rt, tree
Reingold-Tilford tree layout, useful for (almost) tree-like graphs
rt_circular, tree
Reingold-Tilford tree layout with a polar coordinate post-transformation, useful for (almost) tree-like graphs
sphere, spherical, circular_3d
Deterministic layout that places the vertices evenly on the surface of a sphere
- update_link(edge_id='', label='', source='', target='', data=None, url='', style='', src_label='', trgt_label='', new_label=None, new_src_label=None, new_trgt_label=None, src_label_style='', trgt_label_style='')
Method to update edge/link details.
Parameters
edge_id(str) - md5 hash edge id, if not provided, will be generated based on link attributeslabel(str) - existing edge labelsrc_label(str) - existing edge source labeltrgt_label(str) - existing edge target labelsource(str) - existing edge source node idtarget(str) - existing edge target node idnew_label(str) - new edge labeldata(dict) - edge new data attributesurl(str) - edge new url attributestyle(str) - OS path to file or sting containing style to apply to edgenew_src_label(str) - new edge source label`new_trgt_label(str) - new edge target labelsrc_label_style(str) - string with style to apply to source labeltrgt_label_style(str) - strung with style to apply to target label
Either of these must be provided to find link element to update:
edge_idMD5 hash orlabel, source, target, src_label, trgt_labelexisting link attributes to calculateedge_id
edge_idcalculated based on -label, source, target, src_label, trgt_label- attributes following this algorithm:Edge tuple produced:
tuple(sorted([label, source, target, src_label, trgt_label]))MD5 hash derived from tuple:
hashlib.md5(",".join(edge_tup).encode()).hexdigest()
If no
label, src_label, trgt_labelprovided, they substituted with empty values in assumption that values for existing link are empty as well.This method will replace existing or add new labels to the link.
Existing data attribute will be amended with new values using dictionary like update method.
New style will replace existing style.
- update_node(id, label=None, data=None, url=None, style='', width='', height='', **kwargs)
Method to update node details. Uses node
idto search for node to updateParameters
id(str) mandatory, unique node identifierlabel(str) label at the center of the nodedata(dict) dictionary of data items to add to the nodewidth(int) node width in pixelsheight(int) node height in pixelsurl(str) url string to save as node url attributestyle(str) string containing DrawIO style parameters to apply to the node