yEd SVG Viewer
yED SVG Viewer allows to start simple Flask WEB UI application to visualize network data using D3.js library.
yED SVG Viewer supports diagram files in SVG format produced by yED Graph Editor
application using File -> Export -> Save as type: SVG format feature.
This viewer needs to have Flask installed:
pip install flask
Flask installed as part of full extras as well.
Tutorial How to Make SVG Diagrams
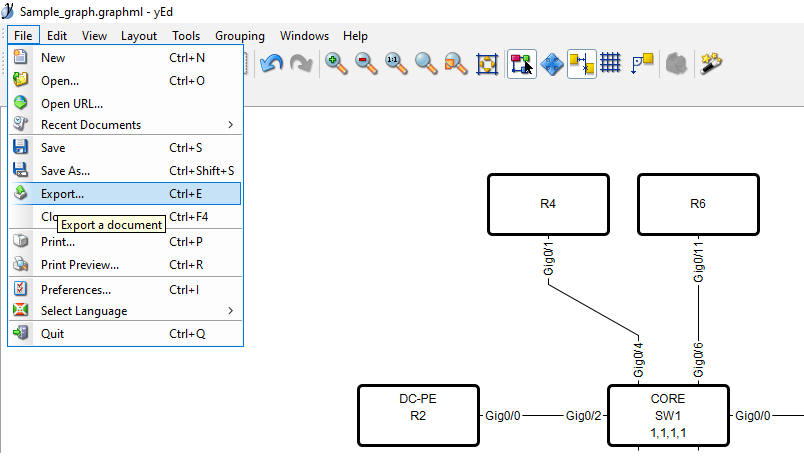
Open diagram in yEd graph editor application and navigate to File -> Export:
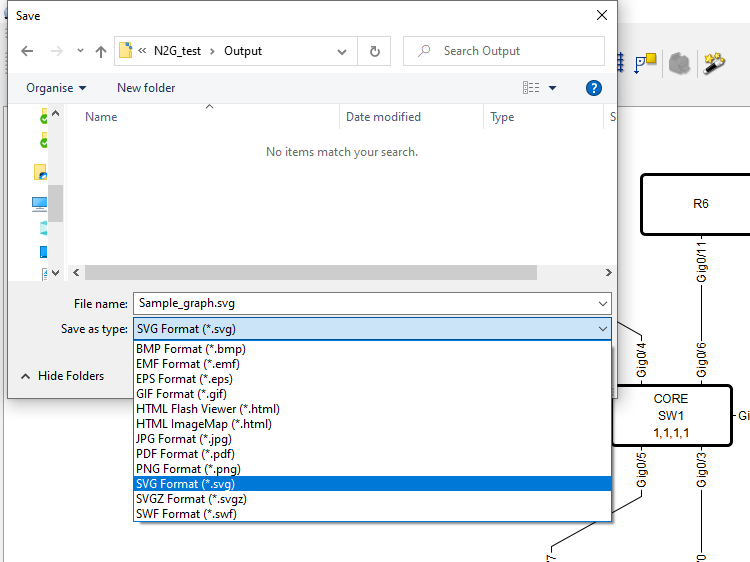
Choose SVG format and click save:
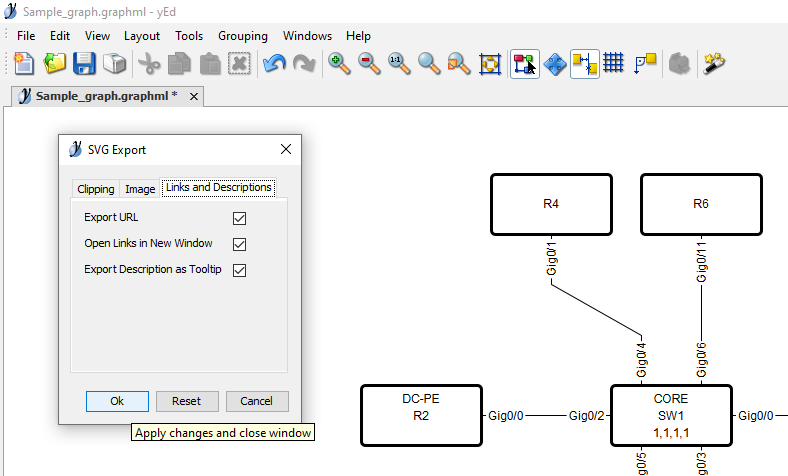
In export menu, make sure to select “Export URL” and “Export Description as Tooltip”, press “Ok” button:
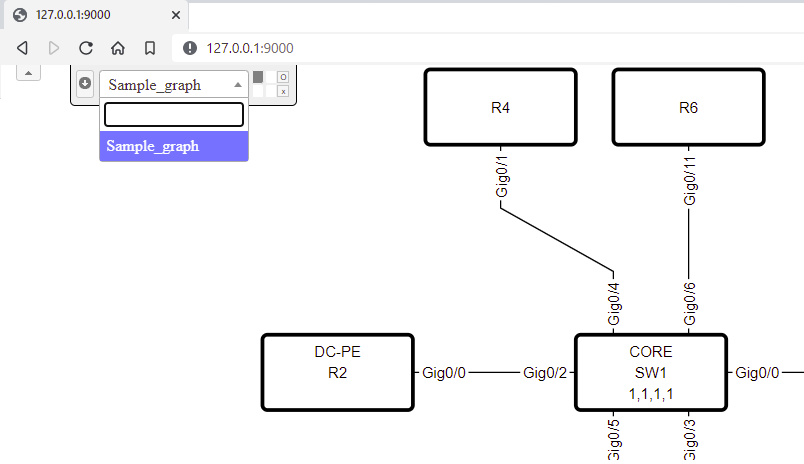
Navigate to folder with exported SVG file and run yEd SVG viewer using N2G CLI tool:
N2G --yed-svg-viewer --diagrams-dir "."
Access WEB UI application via URL http://127.0.0.1:9000 using your browser.
By default Flask server starts and listens on all operating system interfaces, but
specific IP address and port number can be specified as required using --ip and
--port N2G CLI arguments.
OS path to directory with diagram files can be specified using --diagrams-dir
N2G CLI tool argument or using N2G_DIAGRAMS_DIR environment variable. If no
--diagrams-dir argument provided, N2G attempts to retrieve diagrams directory
path using N2G_DIAGRAMS_DIR environment variable.